
Application Note 001: Variants of electrochemical permeation measurement
ABSTRACT
Electrochemical hydrogen permeation measurement following the Devanathan–Stachurski principle (EN ISO 17081:2014, ASTM G148) determines hydrogen uptake and transport in metals from the oxidation current on the permeation-exit side of the sample. This Application Note presents three common variants of electrochemical permeation measurement (uncoated sample, Pd-coated sample with cathodic charging, Pd-coated sample with acidic charging), shows characteristic measurement curves from practice, and describes the setup as well as the software-based execution with two IPS systems of different performance classes (PguTouch-H2 and PGU-OEM-H2).
BACKGROUND
In electrochemical hydrogen permeation measurement, a metal (preferably steel) is charged, either cathodically by electrical current or chemically by acid. During charging, H⁺ protons are formed, which adhere to the metal surface as adsorbed hydrogen atoms. Part of this hydrogen penetrates into the metal, part recombines to H₂ gas and escapes. On the opposite (oxidation) side of the sample, the hydrogen that has diffused in and is dissolved atomically is re-oxidized; the measured current is a direct measure of the permeation flux.
Three variants are common:
1. Uncoated sample, cathodic charging: corresponds most closely to real-world behavior, but delivers a very small, interference-prone measurement signal (ideally measured in a Faraday cage).
2. Sample with single-sided palladium coating on the oxidation side, cathodic charging: palladium acts as a catalyst for the release of H atoms, giving a markedly shorter discharge time (approx. 10 min to < 1 μA) and a better-evaluable signal; in practice, this is the most commonly used method.
3. Pd-coated sample, acidic charging (instead of cathodic): relevant e.g. for assessing pickling processes, optionally with the use of inhibitors to reduce hydrogen formation.
All three variants share the same characteristic curve shape: at the start of the measurement, the rest current (background current) decreases; once it is sufficiently low (target value < 1 μA for unalloyed steel, possibly in the nA range for more highly alloyed steels), the subsequent charging yields an evaluable signal. The current rise after the start of charging initially reflects the occupation of free lattice sites in the metal (trapping phase). Once these are saturated, the current settles into a constant or slightly falling level, approximately proportional to the charging current.
EXPERIMENTAL SETUP AND PROCEDURE
| Parameter | |
|---|---|
| Electrolyte, oxidation side | 0.1–1 molar NaOH solution (suppresses the corrosion current even on an uncoated sample) |
| Electrolyte, charging side | 0,1–1 molar NaCl solution |
| Sample material (starting point) | Steel sheet, thickness 0.05–0.1 mm |
| Charging current (example, Fig. 3, uncoated) | −5 mA (current-density example from the software: −50 A/m² at 1 cm² sample area = −5 mA) |
| Charging current steps (example, Fig. 4, Pd-coated) | −5 / −10 / −20 / −40 mA |
| Setpoint, oxidation side (potentiostat, holdvalue) | 350 mV |
| Run time, charging side (galvanostat) | 30 min (extendable, to avoid premature shutdown) |
| Run time, oxidation side (potentiostat) | 100 h (can be stopped manually at any time) |
| Decay time of background current to < 1 μA | approx. 10 min (Pd-coated, mild steel) or significantly longer (uncoated, depending on degassing pretreatment) |
| Delay until a detectable current rise | 3–5 min |
| Software | EcmWin, started twice (one instance per potentiostat), method „Holdvalue“ (manual/interactive) or „H2 App“ (automated, cyclic measurement with mutual communication between the two instances) |
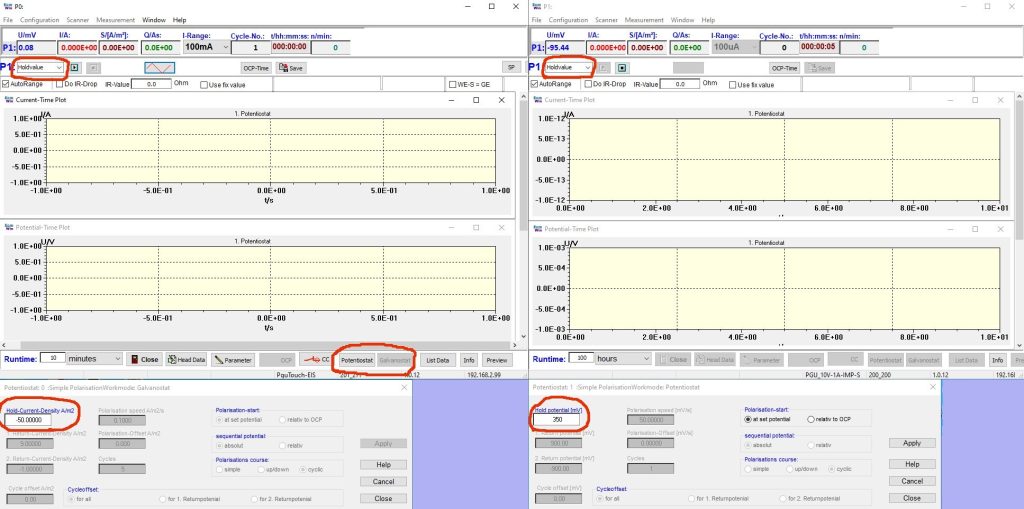
Both potentiostats are connected to a measurement computer via a switch. The EcmWin software is started twice, one instance per device, and the measurement dialog is opened in each (Fig. 1). The experiment can initially be run interactively: the left instance controls the charging side in galvanostatic mode (method „Holdvalue“, e.g. setpoint −50 A/m2 corresponding to −5 mA at 1 cm2 sample area, run time 30 min), the right instance controls the oxidation side in potentiostatic mode (method „Holdvalue“, setpoint 350 mV, run time 100 h). Both setpoint windows can remain open during the measurement; the values can be adjusted on the fly.
To carry out the measurement, the measurement on the oxidation side is started first; the current curve typically begins at 50–100 μA and decays. Once the current drops below 1 μA, charging is switched on via the start button. After a few minutes the oxidation current should rise, then flatten out and finally transition into a flat line or a slight decline. At this point charging can be stopped. This cycle can be repeated manually as often as desired to characterize the sample’s behavior.
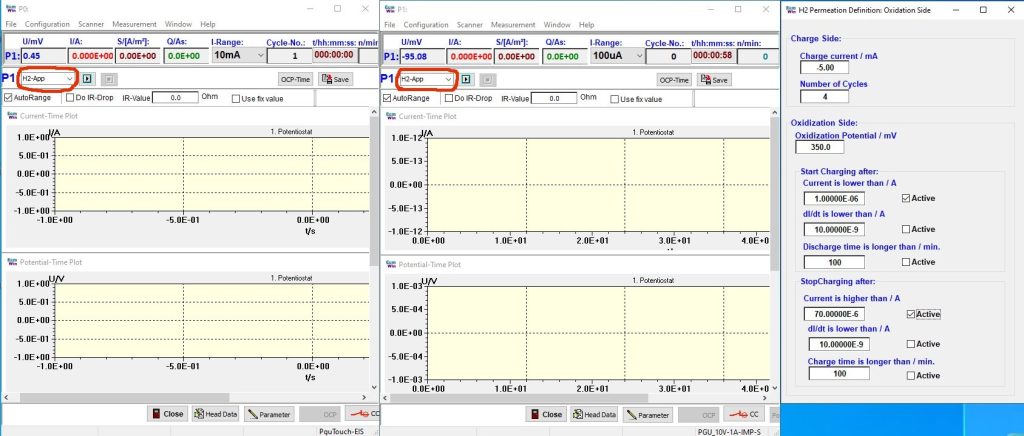
For a fully automated measurement series, the method on the oxidation side is switched to „H2 App“ (Fig. 2). The charging side then automatically switches to the same mode, and both instances communicate directly with each other. In the associated input window, the charging current, the number of repeat cycles, and the current limits for the oxidation side are defined: the lower limit triggers the switch to charging, the upper one the shutdown of charging. Each limit can additionally be secured via a dI/dt or a time condition. If several criteria are active, all of them must be met before the software proceeds to the next process step. This allows the entire charge/discharge cycle to be automated and made reproducible.
The measured values are stored in ASCII format and are available for evaluation once the experiment has finished. During the measurement, the software continuously calculates the accumulated charge quantity. This can be reset after each cycle segment, and the respective final values are logged in the corresponding header file.
RESULTS
Fig. 3 shows the oxidation current on an uncoated steel sample. Without the Pd catalyst, the signal swing upon charging stays small (rise to only 1.5–2 μA with −5 mA charging current) and, in the noisy curve, can only be distinguished from the baseline on close inspection. This underlines why this variant requires a low-interference measurement environment (Faraday cage).
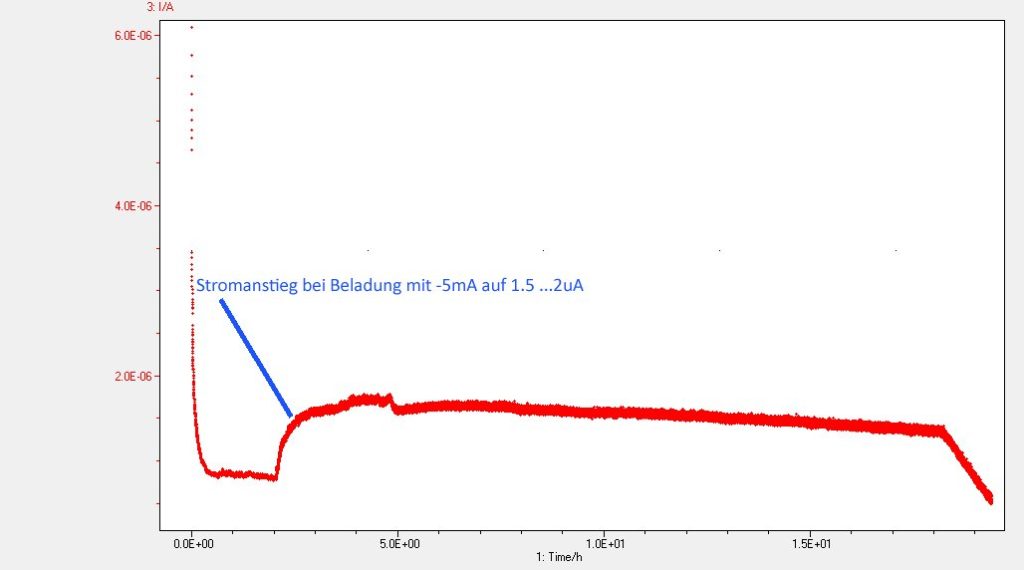
Fig. 4 shows the same measurement on a Pd-coated sample with a stepwise increased charging current (−5 / −10 / −20 / −40 mA). The oxidation current follows each step markedly faster and with a larger swing than on the uncoated sample. This is a visible demonstration of the catalytic effect of the Pd layer. With each further current step, the curve reacts more quickly, since the free lattice sites in the metal are increasingly occupied and fewer H atoms are retained in the steel.
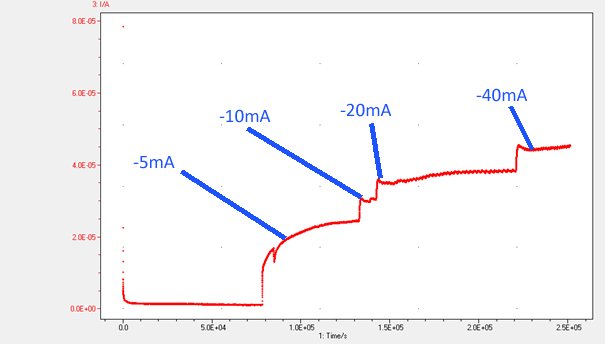
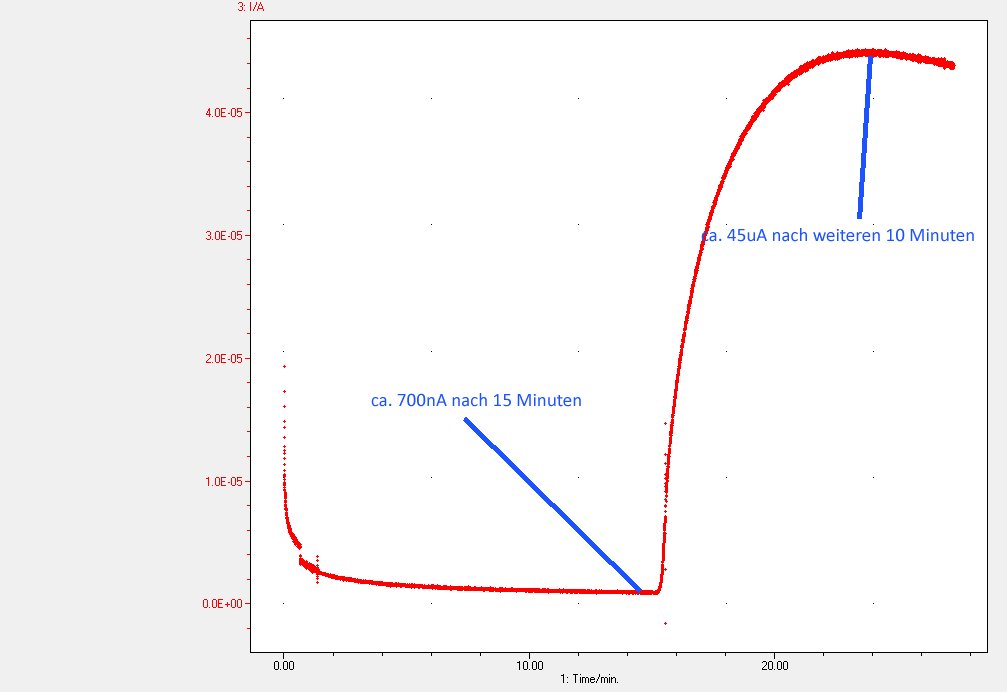
Fig. 5 shows a Pd-coated practical sample that was charged with acid (using inhibitors) instead of cathodically. Characteristic here is the steep rise from approx. 700 nA (after 15 min) to approx. 45 μA (after a further 10 min), which is noticeably faster than in the current-controlled variants in Figs. 3 and 4, since here the hydrogen charging is driven by the chemical reaction itself rather than by an externally controlled current.
The comparison of the three variants shows that the Pd coating not only shortens the measurement time (approx. 10 min rather than sometimes > 15 min decay time), but also provides a clearly structured, stepwise evaluable signal (Fig. 4), whereas the uncoated sample (Fig. 3) shows a markedly weaker and more strongly noise-affected signal.
Der Vergleich der drei Varianten zeigt, dass die Pd-Beschichtung nicht nur die Messzeit verkürzt (ca. 10 min statt teils > 15 min Abklingzeit), sondern auch ein klar strukturiertes, stufenweise auswertbares Signal liefert (Abb. 4), während die unbeschichtete Probe (Abb. 3) ein deutlich schwächeres und stärker verrauschtes Signal zeigt.
DISCUSSION OF POSSIBLE PITFALLS
- Charging started too early: If the background current has not sufficiently decayed by the start of charging, an evaluable current change is barely distinguishable. A sufficiently long waiting period before the start of charging should be planned (target value < 1 μA).
- Leaks at the sample clamping: A sharp peak or an immediate rise in the oxidation current right at the start of charging indicates a leak; check the seal of the sample between the flanges before every measurement, especially after filling with electrolyte.
- Galvanic coupling / ground loop between the charging and oxidation sides: Manifests similarly to a leak (immediate current rise); especially relevant with the PGU-OEM system, which uses a virtual ground (ZRA principle). Pay close attention to consistent galvanic isolation of the modules.
- Sensitivity to interference on an uncoated sample: Without the palladium catalyst, the signal is small and prone to noise; measurement should be performed in a Faraday cage whenever possible, especially for more highly alloyed steels with smaller permeation currents.
- Sample pretreatment: The degassing temperature of the sample influences how long it takes for the rest current to decay sufficiently. Non-standardized pretreatment makes it harder to compare measurement series.
- Missing corrosion protection on the oxidation side: Without a NaOH electrolyte on an uncoated sample, corrosion current can overlay the permeation signal. Without the Pd coating, the difference between background current and permeation current is also small enough that the background current should be subtracted computationally.
- Abrupt increase of the charging current: Too rapid an increase in the charging current is barely visible in the measurement curve. Hydrogen transport through the metal acts as the limiting factor; a stepwise approach (as in Fig. 4) yields more readily interpretable results.
CONCLUSION
Depending on the variant chosen, the electrochemical permeation measurement according to Devanathan–Stachurski provides results of differing informative value and differing levels of effort: the uncoated sample comes closest to real-world material behavior but demands careful shielding and patience. The Pd-coated sample provides faster, more readily evaluable, structured signals and is therefore particularly well suited for routine measurements and comparative series. The PguTouch-H2 system offers a compact, cost-effective entry-level system, while the PGU-OEM-H2 system, with its considerably higher charging current (up to 2 A) and current measurement down into the lower picoampere range, also covers more demanding applications, including CO₂ reduction studies with simultaneous electrochemical pH measurement. Both systems can be operated via the EcmWin software, either manually/interactively or fully automated (H2 App mode with cyclic repetition), making the method suitable both for individual investigations and for systematic measurement series.
EQUIPMENT LIST
System 1: PguTouch-H2
| Component | Specification |
|---|---|
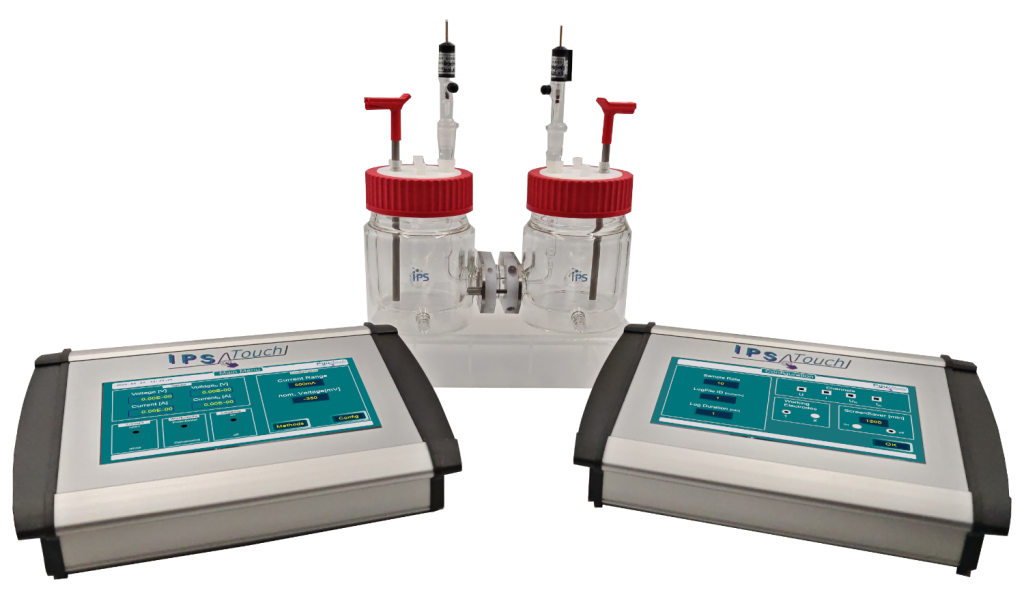
| 2x PguTouch potentiostat/galvanostat | max. 500 mA, smallest current range 1 nA. Measurement principle: working electrode at the housing/supply ground, current measurement in the counter-electrode branch (no error currents from a virtual ground; galvanic isolation between devices not critical) |
| Devanathan cell | small, heatable, approx. 150 ml per cell half |
| Counter electrodes | platinized titanium rods |
| Reference electrodes | Ag/AgCl |
System 2: PGU-OEM-H2
| Component | Specification |
|---|---|
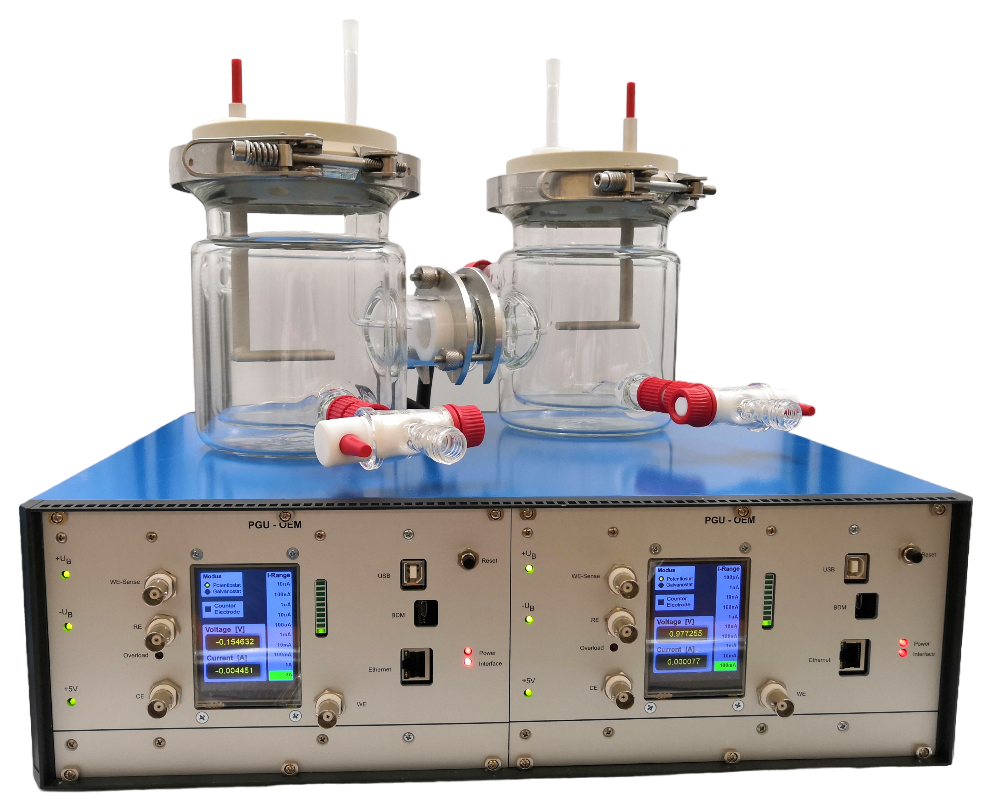
| 1x PGU-OEM-H2 potentiostat/galvanostat | Dual potentiostat; charging side up to 2 A, oxidation side up to 100 mA with resolution down into the lower pA range. Measurement principle on the oxidation side: ZRA (Zero Resistance Ammeter) with virtual ground; double galvanic isolation required/present |
| Devanathan cell | large, heatable (cells interchangeable between the two systems; non-heatable cell also usable) |
| Counter electrode | platinized titanium rods |
| Reference electrodes | Ag/AgCl |
| Additional application | also suitable for CO₂ reduction studies with simultaneous electrochemical pH measurement |
Software: EcmWin (two instances, one per device), methods „Holdvalue“ (manual) and „H2 App“ (automated).